Narrow Violins
Narrow Violins
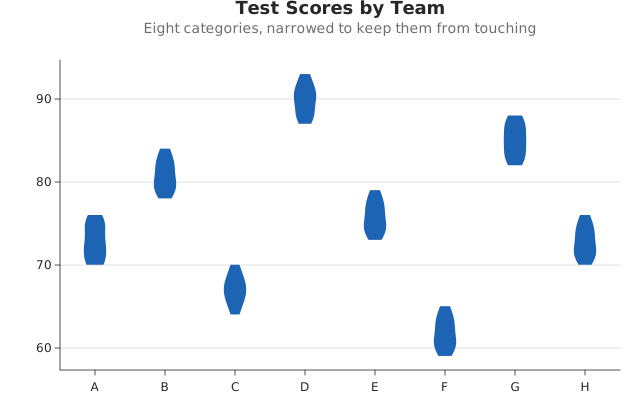
Use this when: You need to narrow violins to keep dense category layouts separated.
Usage
from dataviz import save, violin


def main() raises:
    var teams: List[String] = ["A", "B", "C", "D", "E", "F", "G", "H"]
    var scores: List[List[Float64]] = [
        [70.0, 72.0, 75.0, 71.0, 74.0, 73.0, 76.0, 70.0, 72.0, 75.0],
        [80.0, 82.0, 79.0, 83.0, 81.0, 78.0, 84.0, 80.0, 82.0, 79.0],
        [65.0, 68.0, 66.0, 70.0, 67.0, 69.0, 64.0, 66.0, 68.0, 67.0],
        [90.0, 88.0, 92.0, 89.0, 91.0, 87.0, 93.0, 90.0, 88.0, 91.0],
        [75.0, 77.0, 74.0, 78.0, 76.0, 73.0, 79.0, 75.0, 77.0, 74.0],
        [60.0, 63.0, 61.0, 64.0, 62.0, 59.0, 65.0, 60.0, 63.0, 61.0],
        [85.0, 83.0, 87.0, 84.0, 86.0, 82.0, 88.0, 85.0, 83.0, 87.0],
        [72.0, 74.0, 71.0, 75.0, 73.0, 70.0, 76.0, 72.0, 74.0, 71.0],
    ]

    var plot = violin(
        teams,
        scores,
        width_fraction=0.2,
        title="Test Scores by Team",
        subtitle="Eight categories, narrowed to keep them from touching",
    )
    save(plot, "docs/src/examples/out_narrow_violins.svg")
Related
Related recipes: Comparing Distributions (KDE + Rug) · Violin Bandwidth
Relevant API: Plot encodings