Layer Legend
Layer Legend
Use this when: You need to name each render_layers() layer with .series_name() to get a legend row per layer.
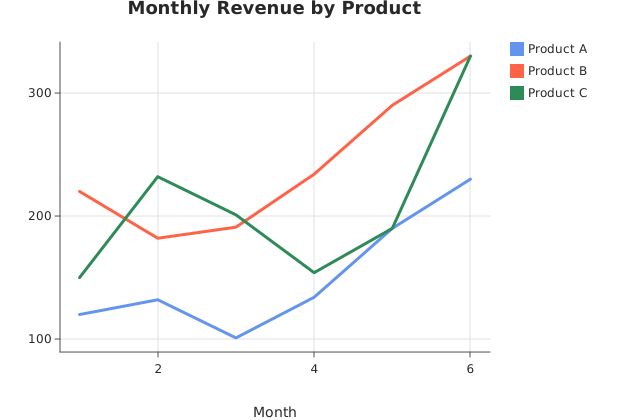
Usage
from dataviz.chart import AnyChart
from dataviz import Plot, save_layers
from dataviz.core.colors import CORNFLOWERBLUE, SEAGREEN, TOMATO
from dataviz.core.theme import Theme


def main() raises:
    var months: List[Float64] = [1.0, 2.0, 3.0, 4.0, 5.0, 6.0]
    var product_a: List[Float64] = [120.0, 132.0, 101.0, 134.0, 190.0, 230.0]
    var product_b: List[Float64] = [220.0, 182.0, 191.0, 234.0, 290.0, 330.0]
    var product_c: List[Float64] = [150.0, 232.0, 201.0, 154.0, 190.0, 330.0]

    var a = (
        Plot()
        .mark_line()
        .encode(x=months, y=product_a)
        .theme(Theme(mark_color=CORNFLOWERBLUE, line_width=3.0))
        .series_name("Product A")
        .labels(title="Monthly Revenue by Product", x_title="Month")
    )
    var b = (
        Plot()
        .mark_line()
        .encode(x=months, y=product_b)
        .theme(Theme(mark_color=TOMATO, line_width=3.0))
        .series_name("Product B")
    )
    var c = (
        Plot()
        .mark_line()
        .encode(x=months, y=product_c)
        .theme(Theme(mark_color=SEAGREEN, line_width=3.0))
        .series_name("Product C")
    )
    var plots: List[AnyChart] = [AnyChart(a), AnyChart(b), AnyChart(c)]
    save_layers(plots, "docs/src/examples/out_layer_legend.svg")
Related
Related recipes: Dual Y-Axis · Isolines Over a Filled Field
Relevant API: Rendering and composition