Bold Points
Bold Points
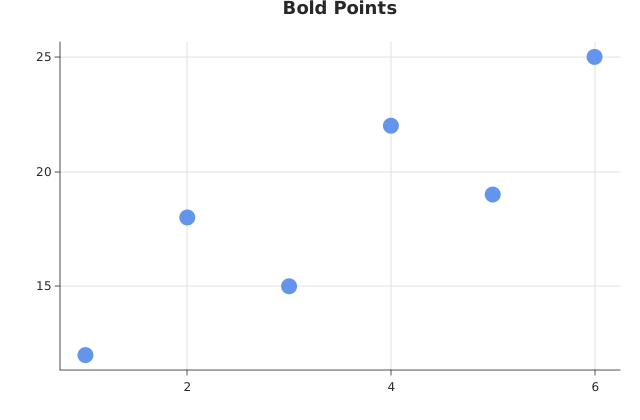
Use this when: You need to draw larger points on a scatter plot by overriding Theme.point_radius.
Usage
from dataviz import Plot, save
from dataviz.core.colors import CORNFLOWERBLUE
from dataviz.core.theme import Theme


def main() raises:
    var x: List[Float64] = [1.0, 2.0, 3.0, 4.0, 5.0, 6.0]
    var y: List[Float64] = [12.0, 18.0, 15.0, 22.0, 19.0, 25.0]

    var plot = (
        Plot()
        .mark_point()
        .encode(x=x, y=y)
        .labels(title="Bold Points")
        .theme(Theme(mark_color=CORNFLOWERBLUE, point_radius=8.0))
    )
    save(plot, "docs/src/examples/out_bold_points.svg")
Related
Related recipes: Subtitle & Axis Title Styling · Smoothed Line
Relevant API: Theme · OutputFormat