Full Axis Box
Full Axis Box
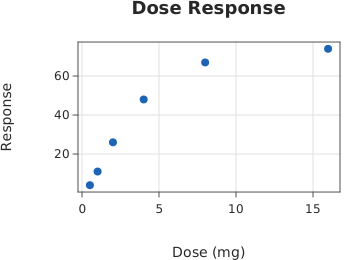
Use this when: You need to draw all four axis lines, the box several journal styles require.
Usage
from dataviz import Plot, save
from dataviz.core.theme import Theme


def main() raises:
    var dose: List[Float64] = [0.5, 1.0, 2.0, 4.0, 8.0, 16.0]
    var response: List[Float64] = [4.0, 11.0, 26.0, 48.0, 67.0, 74.0]

    var plot = (
        Plot()
        .size(360, 260)
        .mark_point()
        .encode(x=dose, y=response)
        .labels(title="Dose Response", x_title="Dose (mg)", y_title="Response")
        .theme(Theme(show_axis_top=True, show_axis_right=True))
    )
    save(plot, "docs/src/examples/out_full_axis_box.svg")
Related
Related recipes: Despine · Axes Through Zero