Data Label Margin
Data Label Margin
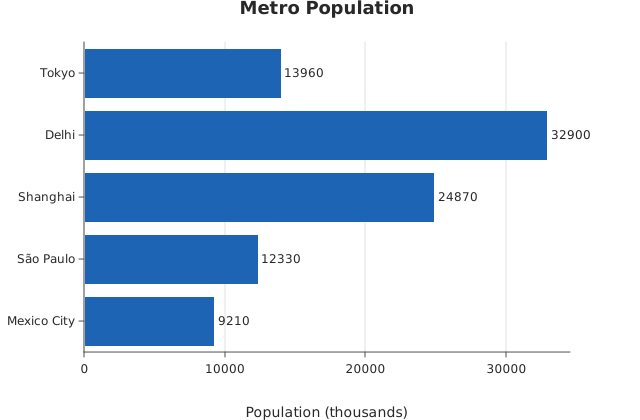
Use this when: You need to widen the right margin to fit labels beyond horizontal bar tips.
Usage
from dataviz import Plot, save
from dataviz.core.theme import Theme


def main() raises:
    var cities: List[String] = [
        "Tokyo",
        "Delhi",
        "Shanghai",
        "São Paulo",
        "Mexico City",
    ]
    var population_thousands: List[Float64] = [
        13960.0,
        32900.0,
        24870.0,
        12330.0,
        9210.0,
    ]

    var plot = (
        Plot()
        .mark_bar(horizontal=True)
        .encode_categorical(x=cities, y=population_thousands)
        .theme(Theme(show_data_labels=True, margin_right=70))
        .labels(title="Metro Population", x_title="Population (thousands)")
    )
    save(plot, "docs/src/examples/out_data_label_margin.svg")
Related
Related recipes: Margin Buffer