Error Bars
Error Bars
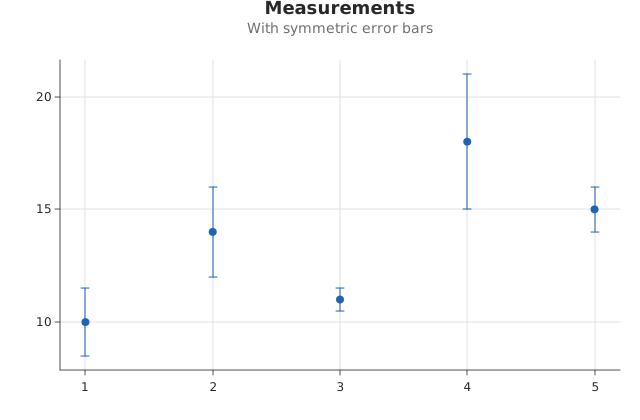
Use this when: You need to draw a symmetric error-bar whisker through each point.
Usage
from dataviz import Plot, save


def main() raises:
    var x: List[Float64] = [1.0, 2.0, 3.0, 4.0, 5.0]
    var y: List[Float64] = [10.0, 14.0, 11.0, 18.0, 15.0]
    var err: List[Float64] = [1.5, 2.0, 0.5, 3.0, 1.0]

    var plot = (
        Plot()
        .mark_point()
        .encode(x=x, y=y, y_err=err)
        .labels(title="Measurements", subtitle="With symmetric error bars")
    )
    save(plot, "docs/src/examples/out_error_bars.svg")
Related
Related recipes: Best-Fit Trend Line · Asymmetric Error Bars
Relevant API: Plot encodings