Minimal Theme
Minimal Theme
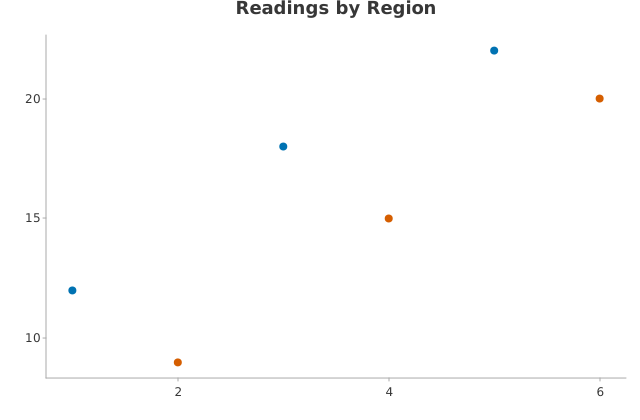
Use this when: You need to apply minimal() for tight margins and subdued axes, then hide the legend when the chart is already self-explanatory.
Usage
from dataviz import Plot, save
from dataviz.core.themes import minimal


def main() raises:
    var x: List[Float64] = [1.0, 2.0, 3.0, 4.0, 5.0, 6.0]
    var y: List[Float64] = [12.0, 9.0, 18.0, 15.0, 22.0, 20.0]
    var region: List[String] = [
        "North",
        "South",
        "North",
        "South",
        "North",
        "South",
    ]

    var theme = minimal()
    theme.show_legend = False

    var plot = (
        Plot()
        .mark_point()
        .encode(x=x, y=y, color_categories=region)
        .labels(title="Readings by Region")
        .theme(theme)
    )
    save(plot, "docs/src/examples/out_theme_minimal.svg")
Related
Related recipes: Dark Theme · SVG Accessibility