Sorted Bars
Sorted Bars
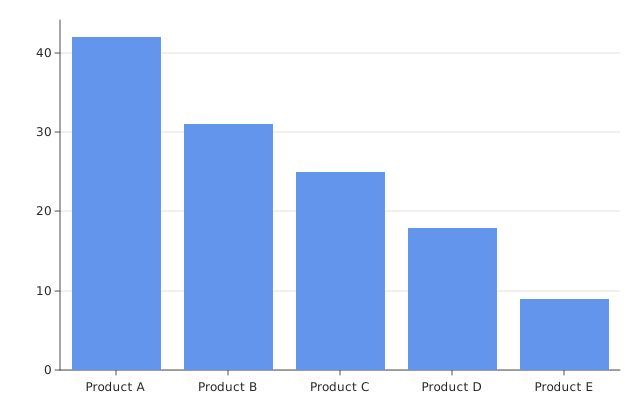
Use this when: You need to sort categories by value before charting them.
Usage
from dataviz import save, bar
from dataviz.core.colors import CORNFLOWERBLUE
from dataviz.core.theme import Theme


def main() raises:
    var categories: List[String] = [
        "Product D",
        "Product A",
        "Product C",
        "Product B",
        "Product E",
    ]
    var values: List[Float64] = [18.0, 42.0, 25.0, 31.0, 9.0]

    # encode_categorical() draws bars in exactly the order given --
    # sort both lists together (descending by value) before
    # building the chart, the same way a spreadsheet's own
    # sort-by-column would.
    for i in range(1, len(values)):
        var v = values[i]
        var c = categories[i]
        var j = i - 1
        while j >= 0 and values[j] < v:
            values[j + 1] = values[j]
            categories[j + 1] = categories[j]
            j -= 1
        values[j + 1] = v
        categories[j + 1] = c

    var c_sorted = bar(
        categories, values, theme=Theme(mark_color=CORNFLOWERBLUE)
    )
    save(c_sorted, "docs/src/examples/out_bar_sorted.svg")
Related
Related recipes: Step Interpolation · Horizontal Bar