Custom Margins
Custom Margins
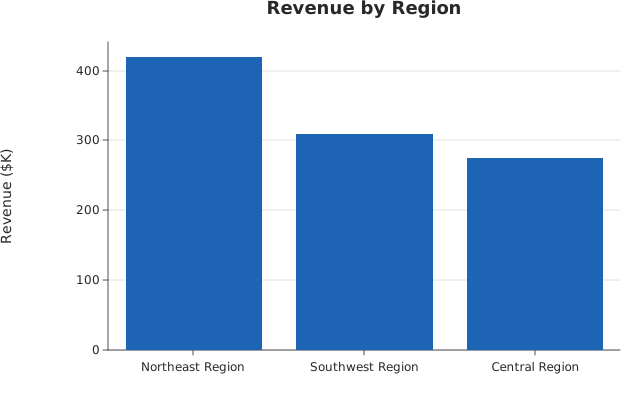
Use this when: You need to widen a plot’s margins to make room for long axis labels or titles.
Usage
from dataviz import Plot, save
from dataviz.core.theme import Theme


def main() raises:
    var categories: List[String] = [
        "Northeast Region",
        "Southwest Region",
        "Central Region",
    ]
    var values: List[Float64] = [420.0, 310.0, 275.0]

    var plot = (
        Plot()
        .mark_bar()
        .encode_categorical(x=categories, y=values)
        .labels(title="Revenue by Region", y_title="Revenue ($K)")
        .theme(Theme(margin_bottom=70, margin_left=90))
    )
    save(plot, "docs/src/examples/out_theme_margins.svg")
Related
Related recipes: Compact Axis Chrome · Margin Buffer