Custom Numeric Container
Custom Numeric Container
Use this when: You need to plot data from your own custom container instead of copying it into a List[Float64] first.
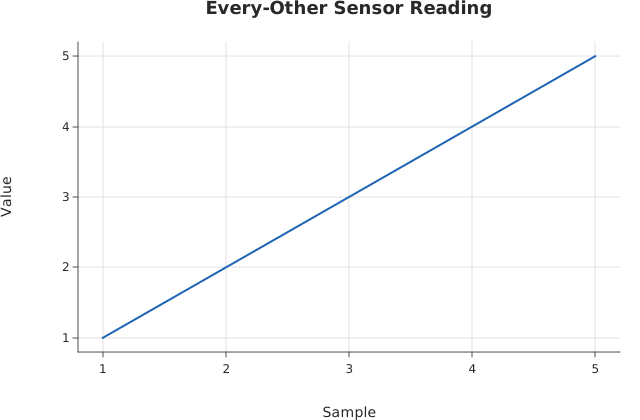
Usage
from dataviz.core.array_like import Float64Sequence
from dataviz import Plot, save


struct EveryOtherReading(Copyable, Float64Sequence, Movable):
    """Stands in for a real-world array-like source (a sensor buffer,
    a dataframe column, ...) -- reads every other entry of an
    underlying list without ever copying it into a new List itself.
    """

    var data: List[Float64]

    def __init__(out self, var data: List[Float64]):
        self.data = data^

    def __len__(self) -> Int:
        return len(self.data) // 2

    def __getitem__(self, idx: Int) -> Float64:
        return self.data[idx * 2]


def main() raises:
    # x and y both come straight from this custom container -- Plot.
    # encode()'s array-like overload requires x/y to share one
    # conforming type (see its own docstring), so both are an
    # EveryOtherReading here rather than mixing it with a plain List.
    var raw_x: List[Float64] = [
        1.0,
        1.0,
        2.0,
        2.0,
        3.0,
        3.0,
        4.0,
        4.0,
        5.0,
        5.0,
    ]
    var raw_y: List[Float64] = [
        1.0,
        1.1,
        2.0,
        2.1,
        3.0,
        3.1,
        4.0,
        4.1,
        5.0,
        5.1,
    ]
    var x = EveryOtherReading(raw_x^)
    var y = EveryOtherReading(raw_y^)

    var plot = (
        Plot()
        .mark_line()
        .encode(x=x, y=y)
        .labels(
            title="Every-Other Sensor Reading",
            x_title="Sample",
            y_title="Value",
        )
    )
    save(plot, "docs/src/examples/out_array_like_data.svg")
Related
Related recipes: NumPy and pandas Data · Custom Categorical Container
Relevant API: Data shapes