One Color Per Category Across Two Charts
One Color Per Category Across Two Charts
Use this when: You need to keep a category the same color in every panel, even when the panels list their categories in a different order or one of them is missing a category entirely, using shared_color_map() to resolve the mapping once and color_map= to hand it to each chart.
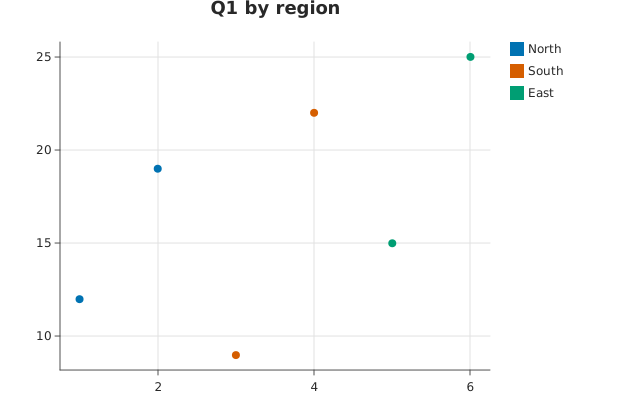
Usage
from std.collections import Dict

from canvas.color import Color

from dataviz.basic.continuous import scatter
from dataviz.core.color_scale import shared_color_map
from dataviz import save


def main() raises:
    # Two quarters of the same three regions. Q2 lists them in a
    # different order and has no "South" row at all, which is the
    # ordinary shape of real data rather than a contrived case.
    var q1_x: List[Float64] = [1.0, 2.0, 3.0, 4.0, 5.0, 6.0]
    var q1_y: List[Float64] = [12.0, 19.0, 9.0, 22.0, 15.0, 25.0]
    var q1_region: List[String] = [
        "North",
        "North",
        "South",
        "South",
        "East",
        "East",
    ]

    var q2_x: List[Float64] = [1.0, 2.0, 3.0, 4.0]
    var q2_y: List[Float64] = [18.0, 24.0, 14.0, 20.0]
    var q2_region: List[String] = ["East", "East", "North", "North"]

    # Each chart resolves its own categories in first-seen order and
    # then indexes the palette by position, so left to themselves the
    # two panels would paint "East" the third palette color in Q1 and
    # the first in Q2. Nothing on either chart would say so.
    #
    # Resolving the mapping once over both panels fixes the color to the
    # name rather than to the position.
    var panels = List[List[String]]()
    panels.append(q1_region.copy())
    panels.append(q2_region.copy())
    var colors = shared_color_map(panels)

    var first = scatter(q1_x, q1_y, title="Q1 by region").encode(
        q1_x, q1_y, color_categories=q1_region, color_map=colors
    )
    var second = scatter(q2_x, q2_y, title="Q2 by region").encode(
        q2_x, q2_y, color_categories=q2_region, color_map=colors
    )

    save(first, "docs/src/examples/out_shared_semantic_mapping_q1.svg")
    save(second, "docs/src/examples/out_shared_semantic_mapping_q2.svg")
Related
Related recipes: One Color Scale Across Two Charts · Black-and-White Multi-Series