Custom Diverging Colors
Custom Diverging Colors
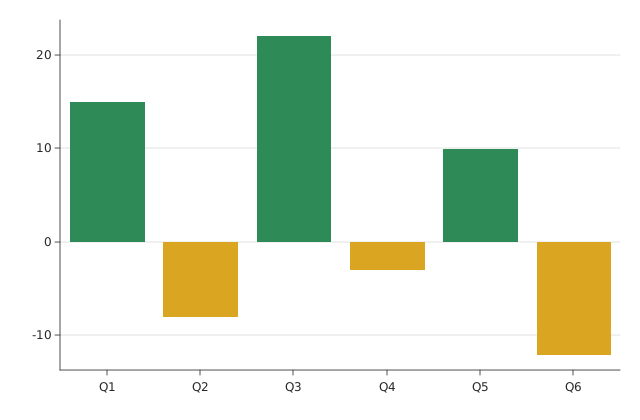
Use this when: You need to pick a diverging bar chart’s own positive/negative colors instead of the default red.
Usage
from dataviz import save, bar
from dataviz.core.colors import SEAGREEN, GOLDENROD
from dataviz.core.theme import Theme


def main() raises:
    var quarters: List[String] = ["Q1", "Q2", "Q3", "Q4", "Q5", "Q6"]
    var net_change: List[Float64] = [15.0, -8.0, 22.0, -3.0, 10.0, -12.0]

    var plot = bar(
        quarters,
        net_change,
        theme=Theme(
            color_by_sign=True,
            mark_color=SEAGREEN,
            mark_color_negative=GOLDENROD,
        ),
    )
    save(plot, "docs/src/examples/out_custom_diverging_colors.svg")
Related
Related recipes: Diverging Bar (Positive/Negative Color) · Center a Diverging Scale on Zero