Bar Zero Baseline
Bar Zero Baseline
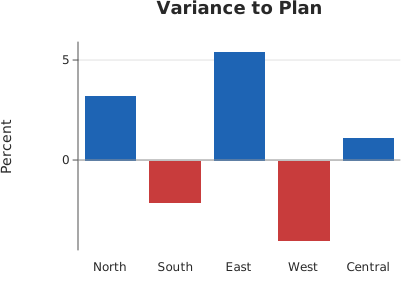
Use this when: You need to draw a bar chart’s zero line through the bars, not under them.
Usage
from dataviz import Plot, save
from dataviz.core.theme import Theme


def main() raises:
    # With values on both sides of zero, the axis line at the bottom of
    # the plot sits at the domain's minimum, which is not a meaningful
    # value. Turning it off and adding a reference line at zero puts the
    # line where the reader needs it: sign becomes something you see
    # rather than something you read off a label.
    var region: List[String] = ["North", "South", "East", "West", "Central"]
    var variance: List[Float64] = [3.2, -2.1, 5.4, -4.0, 1.1]

    var plot = (
        Plot()
        .size(420, 300)
        .mark_bar()
        .encode_categorical(x=region, y=variance)
        .labels(title="Variance to Plan", y_title="Percent")
        .theme(Theme(color_by_sign=True, show_axis_bottom=False))
        .annotate_line(0.0)
    )
    save(plot, "docs/src/examples/out_bar_zero_baseline.svg")
Related
Related recipes: Axes Through Zero · Compact Axis Chrome