Workflow: Comparing Distributions
Workflow: Comparing Distributions
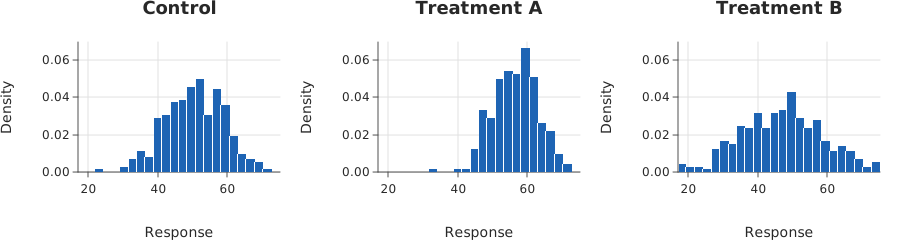
Use this when: You need to compare several groups’ distributions on common numeric bins, as densities that each integrate to one, in panels that share both axes.
Usage
from std.math import cos, log, pi, sqrt

from dataviz.chart import AnyChart
from dataviz import Plot, histogram, save_facets
from dataviz.binned.histogram import HistStat, histogram_bins, shared_bin_edges


def _normal_sample(
    n: Int, mean: Float64, sd: Float64, seed: Int
) -> List[Float64]:
    """`n` draws from a normal distribution, by Box-Muller over a fixed
    linear congruential sequence."""
    var out = List[Float64]()
    var s = seed
    for _ in range(n):
        s = (s * 1103515245 + 12345) % 2147483648
        var u1 = (Float64(s) + 1.0) / 2147483649.0
        s = (s * 1103515245 + 12345) % 2147483648
        var u2 = Float64(s) / 2147483648.0
        out.append(mean + sd * sqrt(-2.0 * log(u1)) * cos(2.0 * pi * u2))
    return out^


def main() raises:
    var names: List[String] = ["Control", "Treatment A", "Treatment B"]
    var samples = List[List[Float64]]()
    samples.append(_normal_sample(300, 50.0, 8.0, 11))
    samples.append(_normal_sample(300, 56.0, 6.0, 23))
    samples.append(_normal_sample(300, 47.0, 11.0, 37))

    # One set of edges over every sample, so a bar in one panel covers
    # the same interval as the bar beside it in the next.
    var edges = shared_bin_edges(samples, bins=24)

    var plots = List[AnyChart]()
    for g in range(len(samples)):
        # Check what the panels claim before drawing them: the common
        # bins really are common, and each density integrates to one.
        var bins = histogram_bins(samples[g], edges, stat=HistStat.DENSITY)
        if bins.edges != edges:
            raise Error(names[g] + ": not on the shared bins")
        var area = 0.0
        for i in range(len(bins.values)):
            area += bins.values[i] * (bins.edges[i + 1] - bins.edges[i])
        if abs(area - 1.0) > 1e-9:
            raise Error(names[g] + ": density integrates to " + String(area))
        plots.append(
            AnyChart(
                histogram(
                    samples[g],
                    edges=edges,
                    stat=HistStat.DENSITY,
                    title=names[g],
                    x_title="Response",
                    y_title="Density",
                    width=300,
                    height=240,
                )
            )
        )

    # Shared x comes from the shared edges -- each histogram pins its
    # axis to the bin range -- and shared y from the facet grid.
    save_facets(
        plots,
        3,
        "docs/src/examples/out_workflow_distribution_comparison.svg",
        shared_y_scale=True,
    )
Related
Related recipes: Workflow: Grouped Estimates with Their Sample Counts · Workflow: A Scatter with Marginals
Relevant API: Data shapes