Despine
Despine
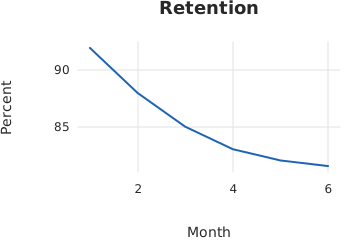
Use this when: You need to drop the axis lines for a frameless chart.
Usage
from dataviz import Plot, save
from dataviz.core.theme import Theme


def main() raises:
    var month: List[Float64] = [1.0, 2.0, 3.0, 4.0, 5.0, 6.0]
    var retention: List[Float64] = [92.0, 88.0, 85.0, 83.0, 82.0, 81.5]

    # Both remaining axis lines off. The tick labels stay, so the chart
    # still says what its numbers are; only the furniture goes.
    var plot = (
        Plot()
        .size(360, 240)
        .mark_line()
        .encode(x=month, y=retention)
        .labels(title="Retention", x_title="Month", y_title="Percent")
        .theme(Theme(show_axis_left=False, show_axis_bottom=False))
    )
    save(plot, "docs/src/examples/out_despine.svg")
Related
Related recipes: Horizontal Beeswarm · Full Axis Box