Mathematical Labels
Mathematical Labels
Use this when: You need to write a title, axis caption, legend entry or annotation as an expression.
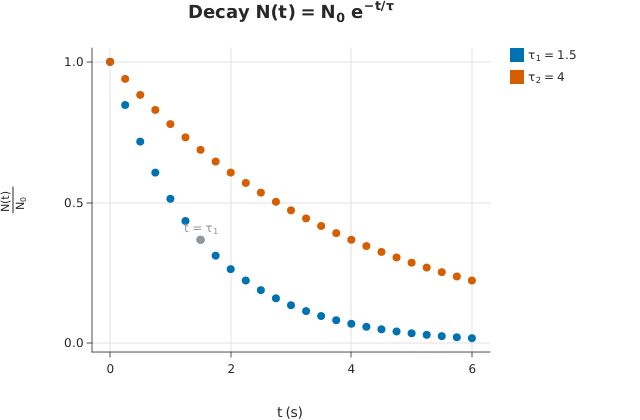
Usage
from std.math import exp

from dataviz import Plot, save


def main() raises:
    # Illustrative decay: samples of exp(-t / tau) at two half-lives.
    var t = List[Float64]()
    var fast = List[Float64]()
    var slow = List[Float64]()
    for i in range(25):
        var ti = Float64(i) * 0.25
        t.append(ti)
        fast.append(exp(-ti / 1.5))
        slow.append(exp(-ti / 4.0))
    var series = List[String]()
    for _ in range(25):
        series.append("$\\tau_1 = 1.5$")
    var both_t = List[Float64]()
    var both_y = List[Float64]()
    for i in range(25):
        both_t.append(t[i])
        both_y.append(fast[i])
    for i in range(25):
        both_t.append(t[i])
        both_y.append(slow[i])
        series.append("$\\tau_2 = 4$")

    var plot = (
        Plot()
        .mark_point()
        .encode(x=both_t, y=both_y, color_categories=series)
        .labels(
            title="Decay $N(t) = N_0 \\, e^{-t/\\tau}$",
            x_title="$t$ (s)",
            y_title="$\\frac{N(t)}{N_0}$",
        )
        .annotate_point(1.5, exp(-1.0), label="$t = \\tau_1$")
    )
    save(plot, "docs/src/examples/out_math_labels.svg")
Related
Related recipes: Point Labels
Relevant API: Plot annotations