Isolines Over a Filled Field
Isolines Over a Filled Field
Use this when: You need to layer tricontour() over tricontourf() so filled bands show magnitude and isolines show exact levels.
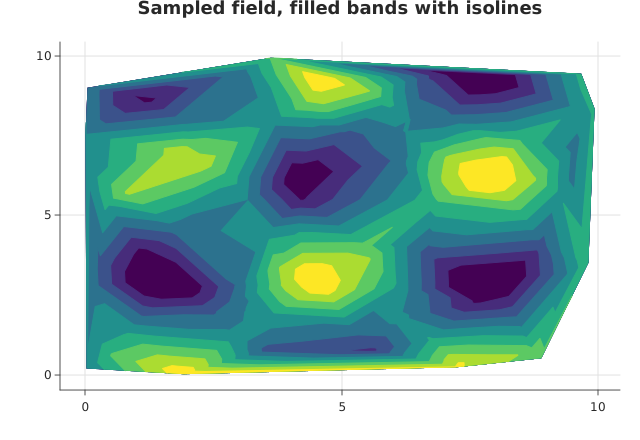
Usage
from std.math import cos, sin

from dataviz.chart import AnyChart
from dataviz import Plot, save_layers
from dataviz.core.theme import Theme
from dataviz.core.colormaps import viridis


def main() raises:
    # A deterministic scatter of samples over a smooth field.
    var x = List[Float64]()
    var y = List[Float64]()
    var z = List[Float64]()
    var seed = 12345
    for _ in range(120):
        seed = (seed * 1103515245 + 12345) % 2147483648
        var px = Float64(seed % 1000) / 100.0
        seed = (seed * 1103515245 + 12345) % 2147483648
        var py = Float64(seed % 1000) / 100.0
        x.append(px)
        y.append(py)
        z.append(sin(px) * cos(py))

    var field = (
        Plot()
        .mark_tricontourf(levels=9)
        .encode_tricontour(x=x, y=y, z=z)
        .theme(Theme(color_ramp=viridis()))
        .labels(title="Sampled field, filled bands with isolines")
        .size(640, 440)
    )
    var isolines = (
        Plot()
        .mark_tricontour(levels=9)
        .encode_tricontour(x=x, y=y, z=z)
        .theme(Theme(color_ramp=viridis(), line_width=1.0))
        .size(640, 440)
    )

    var plots: List[AnyChart] = [AnyChart(field), AnyChart(isolines)]
    save_layers(plots, "docs/src/examples/out_isolines_over_a_field.svg")
Related
Related recipes: Layer Legend · Facets
Relevant API: Rendering and composition