Color Map
Color Map
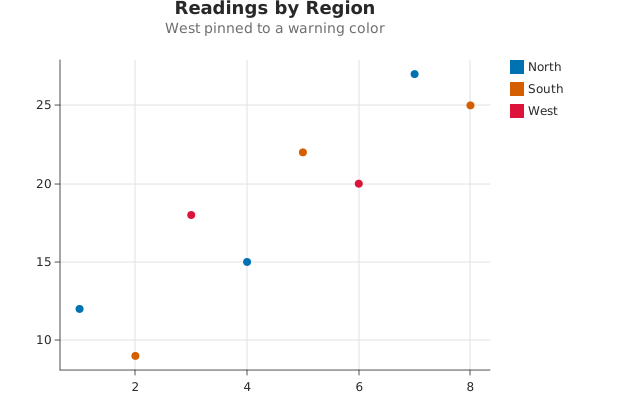
Use this when: You need to pin specific categories to specific colors instead of the automatic first-seen-order palette.
Usage
from dataviz import Plot, save
from dataviz.core.colors import CRIMSON


def main() raises:
    var x: List[Float64] = [1.0, 2.0, 3.0, 4.0, 5.0, 6.0, 7.0, 8.0]
    var y: List[Float64] = [12.0, 9.0, 18.0, 15.0, 22.0, 20.0, 27.0, 25.0]
    var region: List[String] = [
        "North",
        "South",
        "West",
        "North",
        "South",
        "West",
        "North",
        "South",
    ]

    var plot = (
        Plot()
        .mark_point()
        .encode(x=x, y=y, color_categories=region, color_map={"West": CRIMSON})
        .labels(
            title="Readings by Region",
            subtitle="West pinned to a warning color",
        )
    )
    save(plot, "docs/src/examples/out_color_map.svg")
Related
Related recipes: Color by Continuous Variable · Diverging Color Scale