Workflow: A Time Series with an Outage
Workflow: A Time Series with an Outage
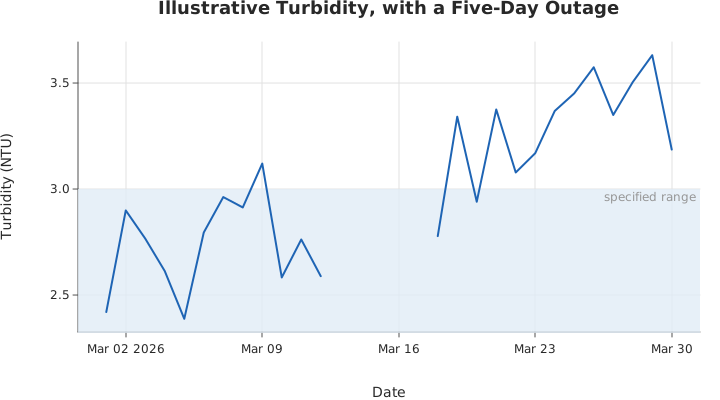
Use this when: You need to plot readings taken on irregular dates, with a stretch where the sensor recorded nothing, so the outage reads as an outage rather than a straight line across it.
Usage
from morrow import Morrow

from dataviz import render_svg, Plot, save
from std.utils.numerics import nan


def main() raises:
    # Illustrative hourly-averaged turbidity, one reading per day, with
    # the sensor offline for five days in the middle. The offline days
    # are in the data as missing readings, which is what a logger
    # exports: the row exists, the value does not.
    var days = List[Morrow]()
    var turbidity = List[Float64]()
    var seed = 20260921
    for i in range(30):
        days.append(Morrow(2026, 3, 1).shift(days=i))
        if i >= 12 and i < 17:
            # The outage. The day is on the axis; the reading is not.
            turbidity.append(nan[DType.float64]())
            continue
        seed = (seed * 1103515245 + 12345) % 2147483648
        var wobble = Float64(seed % 700) / 1000.0
        turbidity.append(2.2 + wobble + Float64(i) * 0.03)

    var path = "docs/src/examples/out_workflow_time_series_gaps.svg"
    var chart = (
        Plot()
        .mark_line()
        .encode_time(days, turbidity)
        .annotate_area(2.0, 3.0, label="specified range")
        .labels(
            title="Illustrative Turbidity, with a Five-Day Outage",
            x_title="Date",
            y_title="Turbidity (NTU)",
        )
        .size(720, 400)
    )
    save(chart, path)

    var f = open(path, "r")
    var svg = f.read()
    f.close()

    # The claim: two runs of readings, so two paths, not one line drawn
    # across the outage. The band and the axis furniture are not paths.
    var line_paths = 0
    var at = 0
    while True:
        var i = svg.find("<polyline", at)
        if i < 0:
            break
        line_paths += 1
        at = i + 9
    at = 0
    while True:
        var i = svg.find('<path d="M', at)
        if i < 0:
            break
        line_paths += 1
        at = i + 10
    if line_paths != 2:
        raise Error(
            "the series should be drawn in two pieces, one on each side of"
            " the outage -- found "
            + String(line_paths)
        )

    # The dates are labeled as dates, not as raw seconds.
    if "March" not in svg and "Mar" not in svg and "03" not in svg:
        raise Error("the x axis is not labeled with dates")

    # And the band a reader compares against is drawn.
    if "specified range" not in svg:
        raise Error("the specified-range band is missing")

    print(
        "time series:",
        len(days),
        "days,",
        5,
        "of them missing, drawn as",
        line_paths,
        "runs",
    )
Related
Related recipes: Workflow: Grouped Estimates with Their Sample Counts
Relevant API: Data shapes