Axes Through Zero
Axes Through Zero
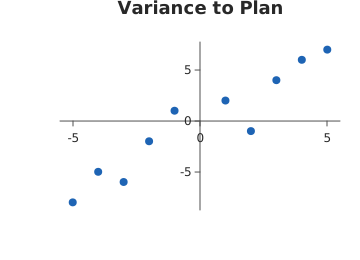
Use this when: You need to cross the axes at the origin so a value’s sign is visible, not read.
Usage
from dataviz.core.axis_position import AxisPosition
from dataviz import Plot, save
from dataviz.core.theme import Theme


def main() raises:
    # Monthly change against plan, in both directions. With the axes at
    # the edges the sign of a point is something you check against a
    # label; with them through zero it is something you see.
    var month: List[Float64] = [
        -5.0,
        -4.0,
        -3.0,
        -2.0,
        -1.0,
        1.0,
        2.0,
        3.0,
        4.0,
        5.0,
    ]
    var variance: List[Float64] = [
        -8.0,
        -5.0,
        -6.0,
        -2.0,
        1.0,
        2.0,
        -1.0,
        4.0,
        6.0,
        7.0,
    ]

    var plot = (
        Plot()
        .size(360, 260)
        .mark_point()
        .encode(x=month, y=variance)
        .labels(title="Variance to Plan")
        .theme(
            Theme(
                x_axis_position=AxisPosition.ZERO,
                y_axis_position=AxisPosition.ZERO,
                show_gridlines=False,
            )
        )
    )
    save(plot, "docs/src/examples/out_axes_through_zero.svg")
Related
Related recipes: Full Axis Box · Bar Zero Baseline