Annotation Colors
Annotation Colors
Use this when: You need to set shared colors for annotation lines, points, areas, and bands.
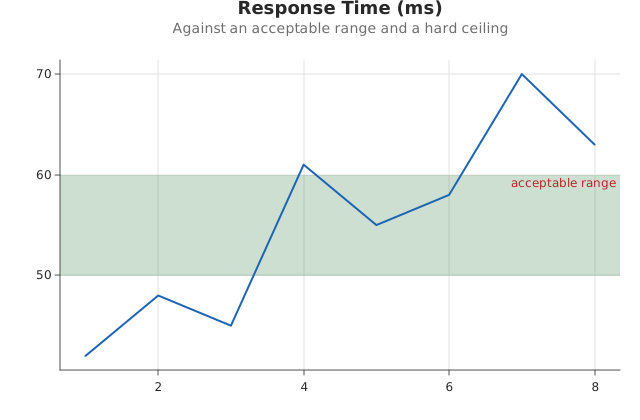
Usage
from canvas.color import Color
from dataviz import Plot, save
from dataviz.core.theme import Theme


def main() raises:
    var x: List[Float64] = [1.0, 2.0, 3.0, 4.0, 5.0, 6.0, 7.0, 8.0]
    var latency: List[Float64] = [
        42.0,
        48.0,
        45.0,
        61.0,
        55.0,
        58.0,
        70.0,
        63.0,
    ]

    var plot = (
        Plot()
        .mark_line()
        .encode(x=x, y=latency)
        .labels(
            title="Response Time (ms)",
            subtitle="Against an acceptable range and a hard ceiling",
        )
        .annotate_area(50.0, 60.0, label="acceptable range")
        .annotate_line(75.0, label="SLA ceiling")
        .theme(
            Theme(
                annotation_color=Color(180, 40, 40),
                annotation_area_color=Color(40, 120, 60, 60),
            )
        )
    )
    save(plot, "docs/src/examples/out_annotation_colors.svg")
Related
Related recipes: Arrow Annotation · Data Labels
Relevant API: Plot annotations