Log Scale (Y-Axis)
Log Scale (Y-Axis)
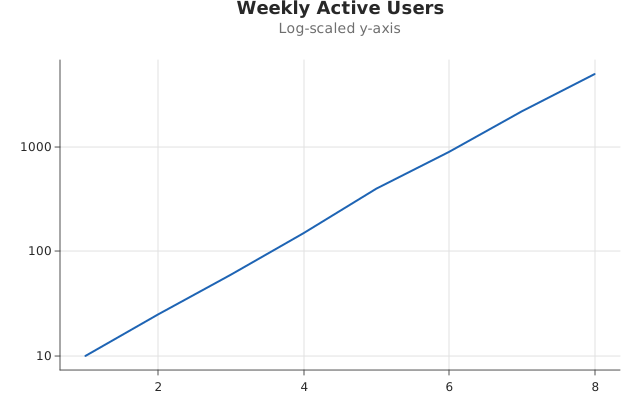
Use this when: You need to scale the y-axis logarithmically (base 10) instead of linearly.
Usage
from dataviz import Plot, save


def main() raises:
    var x: List[Float64] = [1.0, 2.0, 3.0, 4.0, 5.0, 6.0, 7.0, 8.0]
    var users: List[Float64] = [
        10.0,
        25.0,
        60.0,
        150.0,
        400.0,
        900.0,
        2200.0,
        5000.0,
    ]

    var plot = (
        Plot()
        .mark_line()
        .encode(x=x, y=users)
        .labels(title="Weekly Active Users", subtitle="Log-scaled y-axis")
        .scale_y_log()
    )
    save(plot, "docs/src/examples/out_scale_y_log.svg")
Related
Related recipes: Log Scale (X-Axis) · Indexed-to-100 Comparison