Bubble Size Range
Bubble Size Range
Use this when: You need to widen a bubble chart’s pixel size range so small and large values read as more dramatically different, instead of the default range’s more subtle spread.
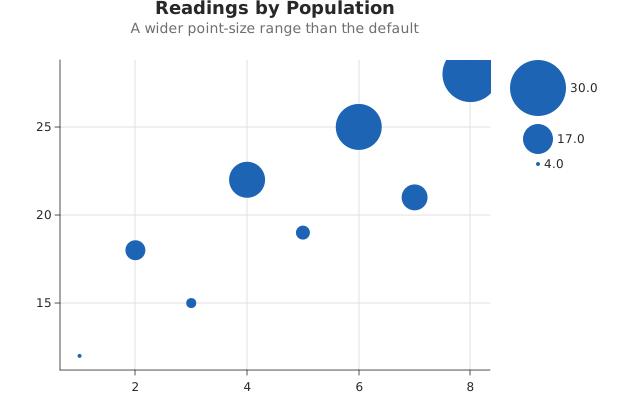
Usage
from dataviz import Plot, save
from dataviz.core.theme import Theme


def main() raises:
    var x: List[Float64] = [1.0, 2.0, 3.0, 4.0, 5.0, 6.0, 7.0, 8.0]
    var y: List[Float64] = [12.0, 18.0, 15.0, 22.0, 19.0, 25.0, 21.0, 28.0]
    var population: List[Float64] = [
        4.0,
        12.0,
        7.0,
        20.0,
        9.0,
        25.0,
        15.0,
        30.0,
    ]

    var plot = (
        Plot()
        .mark_point()
        .encode(x=x, y=y, size=population)
        .labels(
            title="Readings by Population",
            subtitle="A wider point-size range than the default",
        )
        .theme(Theme(size_range_min=2.0, size_range_max=28.0))
    )
    save(plot, "docs/src/examples/out_bubble_size_range.svg")
Related
Related recipes: Bubble Size · Comparing Distributions (KDE + Rug)
Relevant API: Plot encodings