Horizontal Box
Horizontal Box
Use this when: You need to draw a box plot with categories running top-to-bottom and each box-and-whiskers drawn left-to-right instead of the default vertical layout.
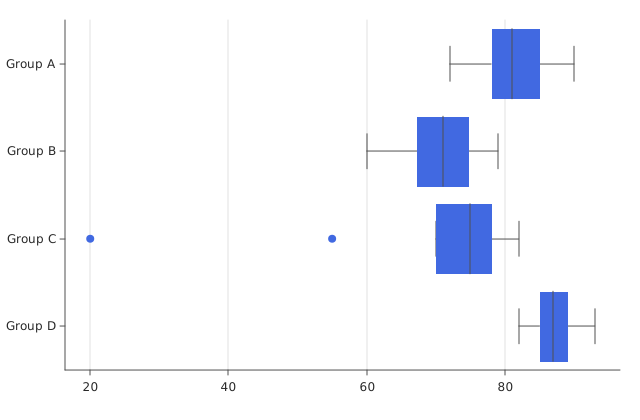
Usage
from dataviz import Plot, save
from dataviz.core.colors import ROYALBLUE
from dataviz.core.theme import Theme


def main() raises:
    var groups: List[String] = ["Group A", "Group B", "Group C", "Group D"]
    var scores: List[List[Int]] = [
        [72, 75, 78, 80, 81, 83, 85, 88, 90],
        [60, 65, 68, 70, 72, 74, 77, 79],
        [55, 70, 73, 75, 76, 78, 80, 82, 20],
        [82, 84, 85, 86, 87, 88, 89, 91, 93],
    ]

    var plot = (
        Plot()
        .mark_box(horizontal=True)
        .encode_boxplot(categories=groups, values=scores)
        .theme(Theme(mark_color=ROYALBLUE))
    )
    save(plot, "docs/src/examples/out_horizontal_box.svg")
Related
Related recipes: Horizontal Lollipop · Horizontal Violin