Horizontal Bar
Horizontal Bar
Use this when: You need to draw a bar chart with categories running top-to-bottom and bars extending left-to-right instead of the default vertical layout.
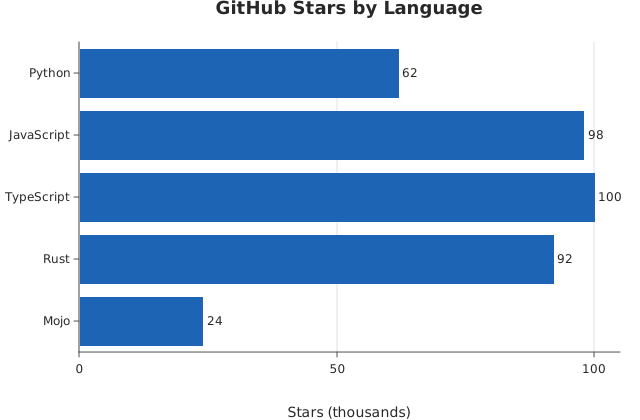
Usage
from dataviz import Plot, save
from dataviz.core.theme import Theme


def main() raises:
    var languages: List[String] = [
        "Python",
        "JavaScript",
        "TypeScript",
        "Rust",
        "Mojo",
    ]
    var stars_thousands: List[Int] = [62, 98, 100, 92, 24]

    var plot = (
        Plot()
        .mark_bar(horizontal=True)
        .encode_categorical(x=languages, y=stars_thousands)
        .theme(Theme(show_data_labels=True))
        .labels(title="GitHub Stars by Language", x_title="Stars (thousands)")
    )
    save(plot, "docs/src/examples/out_horizontal_bar.svg")
Related
Related recipes: Sorted Bars · Horizontal Grouped Bar